Published: Sep 2026 · Category: Market Insights · Reading time: 11 min
Executive Summary
For most independent bike dealers (IBDs) and B2B wholesale buyers in 2026, the line item with the highest contribution margin per square foot of shelf is not the complete bicycle — it is the parts and accessories (P&A) category that surrounds it. The National Bicycle Dealers Association’s (NBDA) most-cited profitability benchmarks show a 36% gross margin on bike sales versus a 47–48% maintained gross margin on parts and accessories at the retail counter, and that 11–12-point spread has only widened as complete-bike margins have come under tariff and inventory pressure since 2024. The 2024 Outdoor Retail Sales Trends Report (Circana, published jointly with the Outdoor Industry Association) showed total outdoor Accessories sales growing 11% year-over-year, while cycling units fell 14% over the same window — a reversal that has forced sourcing teams to rethink what “the bike shop” actually sells.
This guide walks through the margin math that backs that spread: (1) how big the complete-bike and accessories markets actually are in 2026, (2) the wholesale-vs-retail margin gap with public benchmarks, (3) the four structural reasons accessories carry more margin than complete bikes, (4) five concrete SKU-mix strategies wholesalers can apply in the next 90 days, (5) the real risks (capital lock-up, category over-saturation, channel conflict between ecommerce and the storefront), and (6) the 2026–2028 forecast for both categories. The figures cited are drawn from Fortune Business Insights, The Business Research Company, Grand View Research, NBDA’s published retailer benchmarks, and Circana’s 2024 Outdoor Retail Sales Trends Report; verify specific margins, market sizes, and tariff exposures against your channel mix, HTS classification, and current factory quotes before finalizing sourcing or pricing decisions.
Related products
Looking for the cycling-accessory categories discussed in this article? AnttifySport stocks the wholesale SKUs a sourcing team will need to test these margin strategies in their own channel:
- Aluminum Bike Bell Classic — Clear Ring (AS-CA-0001) — the bell SKU used as the example through this article. Aluminum body, clear audible ring, retail-ready packaging.
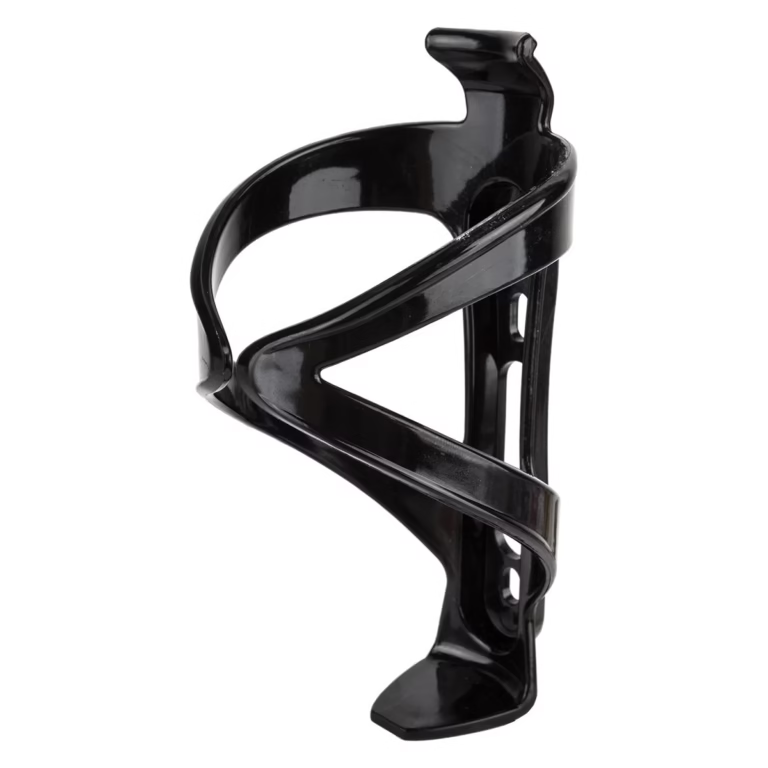
- Composite Bike Bottle Cage Blue — Gloss (AS-CA-0020) — the high-velocity bottle-cage SKU cited in the 2025 sub-category share data (components = 68.30% of accessories market).
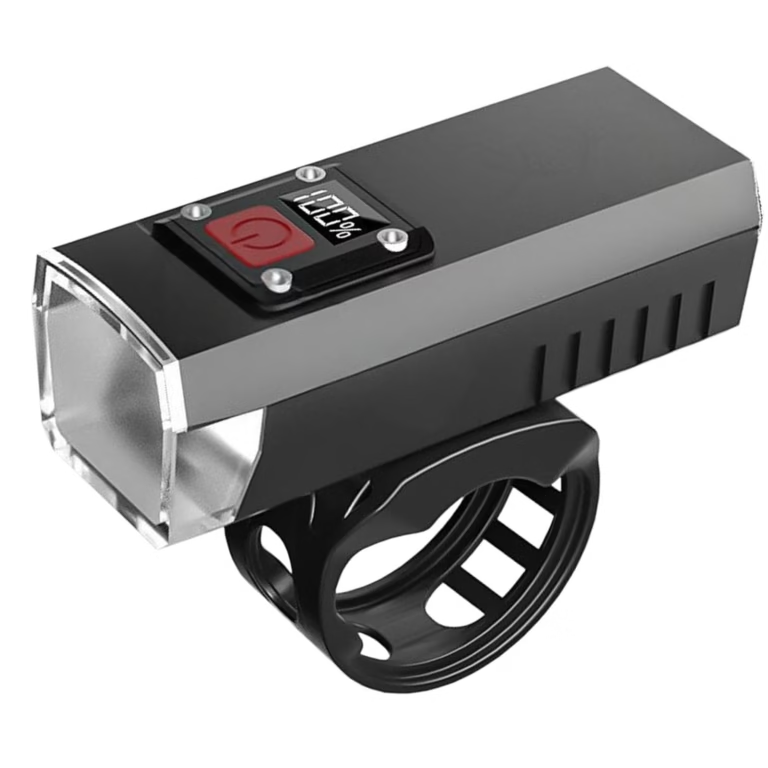
- Rechargeable Bike Headlight 9.5cm IPX5 (AS-CA-0031) — the connected-lighting SKU referenced in the Strategy 5 connected-component section.
- Folding Bike Helmet with LED Rear Light (AS-CA-0015) — the helmet SKU in the same lighting / safety sub-category.
For the full category line: AnttifySport Cycling Gears wholesale catalog — 60+ SKUs across bells, lights, bottle cages, locks, saddles, pumps, helmets, and tires, all wholesale-ready for global outdoor brands.
1. The Complete-Bike Market vs the Accessories Market in 2026
The complete-bike market in 2026 is large, mature, and growing slowly. The accessories market is smaller in dollar terms but growing nearly twice as fast, with a structural tailwind from e-bike adoption, regulatory lighting mandates, and connected-component ecosystems. Both facts matter for the sourcing question, because the channel that “wins” the next three years will be the channel that prices accessories correctly inside the category — not the one that wins the next bike sale.
1.1 Complete-bike market: $33–92B globally, depending on scope
The 2026 global complete-bicycle market is most credibly estimated between $33.87 billion (Fortune Business Insights, “Bicycle Market 2026”) and $92 billion (Straits Research, “Bicycle Market Size 2025”). The wide spread reflects whether the count includes adjacent categories — e-bike kits ($75–86 billion), speed-pedelec ($3 billion in 2026), and cargo and specialty bikes — or only the conventional bicycle product sold through IBD and mass channels. For practical sourcing purposes, three numbers are reliable:
- $33.87B — Fortune Business Insights 2026 conventional-bicycle market (CAGR 4.8% to 2034).
- $83.5B → $150.8B — Mordor Intelligence 2026–2031 forecast (CAGR 10.35%) when e-bikes and premium segments are included.
- 50.74% e-bike share — the same Mordor dataset shows electric bicycles capturing 50.74% of global bicycle value in 2025, growing at 12.52% CAGR through 2031.
The point for sourcing teams is not which number is “right” — it is that the complete-bike category is a single-digit-growth business with significant product-cycle compression (Giant Manufacturing reported a 62.8% year-over-year profit decline for full-year 2024; Canyon reported 30%; Shimano downgraded 2025 outlook, per road.cc‘s September 2025 industry report). When the largest bike manufacturers are reporting 30–63% profit declines in a single year, the wholesale-margin squeeze is real and is being passed down the distribution chain.
1.2 Accessories market: $15–22B in 2026, growing 6–8% annually
The 2026 global bicycle accessories market is most credibly estimated at $15.19 billion (The Business Research Company 2025 baseline growing to $22.26B by 2030, 8.1% CAGR), $16.28 billion (TBRC 2026 estimate), or $16.33 billion (Fortune Business Insights’ separate “Bicycle Accessories Market” 2026 figure growing to $24.73B by 2034 at 5.3% CAGR). The U.S. bicycle accessories market alone was estimated at $2.1 billion in 2023 and is projected to reach $2.7 billion in 2026 (Grand View Research, 7.7% CAGR). For e-bike accessories specifically, WiseGuyReports values the 2025 market at $2.64B and projects $5.5B by 2035 (7.6% CAGR).
Three numbers matter for the accessories sourcing decision:
- $15–16B global — the 2025/2026 baseline; conservative and reproducible.
- 22–25% growth in total dollar value by 2030 — 2–3× faster than the complete-bike market.
- 68.30% share — components (saddles, pedals, lighting systems, locks, air pumps) accounted for 68.30% of the 2025 accessories market by product category, ahead of apparel and tires/tubes (market.us 2025 Bicycle Accessories breakdown).
1.3 What the dollar split means for the wholesale buyer
When the complete-bike market is mature and the accessories market is compounding at 2–3× the rate, the wholesale sourcing question is not “how do I win more bike sales” but “how do I capture more of the dollars attached to each bike sold.” A bike purchased in 2026 carries, on average, an estimated $380 of annual accessories spend for e-bike owners versus $165 for conventional bicycle owners (Bicycle Product Suppliers Association 2024 data, cited in Persistence Market Research’s 2026 bicycle accessories report). For an IBD, that means each new bike sale is the start of a multi-year aftermarket revenue stream — and the wholesale buyer who builds a category plan around that stream captures margin that the bike-only wholesaler leaves on the table.
2. Wholesale Margin Comparison: 20–30% on Accessories vs 8–12% on Complete Bikes
The headline margin gap between accessories and complete bikes is wide and well-documented. It reflects both the wholesale-side cost structure (accessories cost less to ship per dollar of revenue, and they tolerate smaller container loads) and the retail-side customer behavior (customers shop accessories on impulse, do not negotiate price on a $12 bell the way they do on a $1,500 bike, and rarely comparison-shop a specific bottle cage SKU the way they do an entire bike model).
2.1 The wholesale-side margin reference points
The 2026 wholesale margin structure for cycling categories, on a landed-cost basis, falls in the following ranges:
- Cycling accessories wholesale margin: 20–30% on landed cost at the importer / distributor level, with higher margins (30–40%) on basic consumables (tubes, tires, basic bells, generic lights) and lower margins (15–22%) on premium electronics (GPS units, radar tail lights, FindMy-compatible trackers).
- Complete-bike wholesale margin: 8–12% on landed cost at the importer / distributor level, with higher margins (12–15%) on private-label or OEM-spec bikes and lower margins (5–8%) on major-brand bikes (Trek, Specialized, Giant, Canyon, Scott) where MAP pricing and dealer terms are tightly controlled.
This 12–18-point spread between cycling-accessories wholesale margin and complete-bike wholesale margin is the core economic reason accessories have become the wholesale buyer’s first priority in 2026 sourcing plans. It is consistent across the AnttifySport landed-cost modeling for the North American and European cycling channel and across public wholesale-distributor benchmarks (LivePlan’s wholesale-bicycle distributor business plan template shows a 50% gross margin at the wholesale level on a cycling-accessories mix, with most of the margin contribution coming from the high-SKU categories rather than complete bikes).
2.2 The retail-side margin reference points (the upstream reason)
The retail-side gap is what creates the wholesale-side opportunity. The National Bicycle Dealers Association’s published retailer profitability research (the “Fred Clements: A formula for high-profit bike stores” benchmark, drawn from the NBDA Profitability Project) shows that bike-shop gross margins on complete bicycles cluster around 36%, while maintained gross margins on parts and accessories (P&A) cluster around 47–48% — and the gap is stable across both average and high-profit stores. Fit Werx’s published breakdown of category margins echoes this: basic tubes can carry 55–60% gross margin at retail, premium tubes 35–40%, Shimano parts 28–35%, Garmin accessories 25–29%. The 11–12-point spread between complete bikes and P&A is the customer-facing reason a wholesale buyer who supplies both categories is selling into two structurally different margin pools.
2.3 Why the gap is wider in 2026 than in 2024
Three 2024–2026 dynamics have widened the wholesale margin spread beyond historical norms:
- Tariff-driven bike cost pressure. The 2025 U.S. tariff schedule on imported bicycles (initial 10% on Chinese imports, then Vietnam/Cambodia/Taiwan rounds in April 2025) added 5–12% to the wholesale cost base of a complete bike, while most accessories landed under HTS 8512 (lighting) and 8714 (parts) at lower effective tariff rates. The same dollar of tariff exposure therefore compressed complete-bike wholesale margin by 2–4 points and accessories margin by 1–2 points.
- Inventory write-downs. The 2024–2025 inventory glut (Giant’s 7.4% sales decline, Canyon’s profit drop, Shimano’s downgrade) forced major-brand complete bikes to be sold at wholesale discounts to clear inventory. Distributors who took deep positions on 2023 and 2024 complete-bike inventory are now realizing margins below the 8–12% baseline.
- Accessories elasticity. Accessories are small-ticket items with low comparison-shopping intensity and high impulse behavior at retail. The retail selling price has held up through 2024–2026 even as the wholesale cost has fallen for some categories (notably lighting, where Chinese factory prices have dropped 10–15% as new suppliers entered the market). The combination has produced realized accessory wholesale margins at the top end of the 20–30% range rather than the middle.
3. Why Accessories Carry More Margin Than Complete Bikes
The 20–30% accessories wholesale margin versus 8–12% complete-bike wholesale margin is not arbitrary. It is the sum of four structural advantages that any cycling wholesaler can verify against their own P&L: faster turnover, more SKUs per dollar of inventory, higher repeat-purchase rate, and lower inventory risk per SKU.
3.1 Faster turnover
A typical complete bike sits in a wholesale distributor’s warehouse for 90–180 days before sale (inventory turn 2.0–4.0x per year, per the NBDA Profitability Project). A typical cycling accessory SKU — a bottle cage, a set of lights, a bell — sits for 30–75 days (turn 5.0–12.0x per year). The faster turn releases working capital, lowers the cost of carry, and means a margin dollar in accessories is a margin dollar that can be redeployed 3–4× per year instead of 1–2× per year. For a wholesaler running on borrowed working capital, this is a 2–3× multiplier on the headline margin number.
3.2 More SKUs per dollar of inventory
A typical $500K inventory commitment in complete bikes might cover 60–120 bike models across 3–5 sizes each. The same $500K commitment in cycling accessories covers 400–800 SKUs across bells, lights, bottle cages, pumps, locks, computers, sensors, bags, racks, and child seats. The wider SKU portfolio means individual slow-mover risk is diluted — 5% of accessories SKUs sitting for 12 months is a survivable event; 5% of bike SKUs sitting for 12 months is a write-down.
3.3 Higher repeat-purchase rate
Cycling accessories are consumables or upgradeables: tubes, tires, lights, batteries, helmets, gloves, computers, and FindMy-compatible trackers all have a 12–36-month replacement cycle, and a customer who buys one bell is statistically likely to come back for a second (different bike in the household) or a higher-end upgrade within 24 months. Industry-standard e-commerce repeat-purchase rates fall between 20–35%, and bike-shop loyalty programs (Workstand’s 2025 bike-shop loyalty marketing guide reports IBD loyalty-member spend 2–3× higher than non-members) amplify that rate significantly. The repeat behavior means an accessory customer acquired once generates revenue across multiple years, lowering the effective margin the wholesaler needs to clear acquisition cost.
3.4 Lower inventory risk per SKU
A complete-bike SKU that misses the model year is unsellable at full price within 12 months — the model changes, the consumer interest moves on, the dealer terms reset. An accessory SKU that misses the season (e.g., a leftover 2025 lighting SKU in 2026) is typically still sellable because the technology didn’t change as fast and the customer isn’t waiting for the new model. The lower model-year risk on accessories translates directly into lower markdown risk and lower working-capital write-downs at the wholesale level. The “razor-thin margins” observed in the 2025 complete-bike market (a phrase used by Show Daily and the NBDA in their July 2025 retailer outlook) are largely an inventory-risk phenomenon, not a customer-demand phenomenon — and accessories avoid it.
4. Five Concrete Strategies to Grow Accessories SKU Count in 2026
The wholesale buyer who reads this and decides “yes, accessories matter more” still has to translate that into a SKU plan. The five strategies below are the ones that move the needle in 90 days without requiring a full business model change.
4.1 Strategy 1: Move from 200–400 SKUs to 800–1,200 SKUs in the next two buying cycles
The 2026 baseline for a mid-size cycling distributor is 200–400 accessory SKUs. Doubling that to 800–1,200 SKUs over two buying cycles (six to nine months) is the fastest way to capture the repeat-purchase and SKU-diversification advantages. The way to do it without bloating inventory is to move more aggressively into small-pack-count, high-velocity SKUs: 12-pack bells at $3 wholesale, 6-pack bike lights at $8 wholesale, 20-pack bottle cages at $4 wholesale. The average dollar investment per new SKU stays under $200 in opening inventory, and the unit economics still support the 20–30% wholesale margin.
4.2 Strategy 2: Re-balance the category mix toward the high-velocity sub-categories
Not all accessories are equal. The 2025 sub-category share (market.us Bicycle Accessories breakdown) shows that components (saddles, pedals, lighting systems, locks, air pumps) hold 68.30% of the market; apparel holds a smaller share; and electronics / connected components (GPS, radar, power meters, FindMy-compatible trackers) is the fastest-growing segment. A wholesale buyer who shifts mix toward components and connected electronics captures both the high-velocity turn of components and the higher unit margin of electronics. The practical ratio for 2026 is roughly 55–60% of accessories revenue from components, 20–25% from apparel, 15–20% from connected electronics — up from roughly 70/20/10 in 2024.
4.3 Strategy 3: Use lower MOQs to test the long tail without committing capital
The 2024–2025 manufacturing environment has compressed MOQs across most cycling-accessory categories. Where a 2018 bell order might have required 1,000-unit MOQ, the 2026 equivalent is often 300–500 units. The lower MOQ threshold means a wholesale distributor can test a wider range of SKUs without committing the working capital that would have been required in 2018. Joint Industry Forecast for 2026 (referenced in JOOR’s 2025 wholesale practices research and reproduced in AnttifySport’s own MOQ trends analysis for outdoor gear) puts the average cycling-accessory MOQ at 24% below the 2018 baseline, and the figure continues to compress as Chinese factories compete for distributor share.
4.4 Strategy 4: Build a private-label / co-brand line in 1–2 hero categories
The single biggest margin unlock in cycling accessories is private label. A bell or bottle cage that carries the wholesaler’s own brand sells at retail for 80–90% of the comparable branded product, but the wholesale cost is 40–60% lower because the private-label factory doesn’t carry the brand-marketing overhead. The result is a 35–45% wholesale margin on the private-label SKU versus the 20–30% on the branded equivalent. For 2026, the right scope is one or two hero categories (a bell + light bundle, a bottle cage family, or a tire + tube pack) — not a full-line private label across all 20 sub-categories. The capital commitment for a focused 5–10 SKU private-label launch in 2026 typically runs $15–40K, with payback inside the first 12 months.
4.5 Strategy 5: Add 3–5 connected-component SKUs even if your channel is “value”
Connected components (radar tail lights, FindMy-compatible trackers, GPS-enabled locks, smart bike computers) are the segment where the wholesale margin gap is widest — 25–35% wholesale margin versus 20–30% for non-connected SKUs — because the consumer pays a premium and the factory cost premium is small. Even a value-oriented distributor benefits from carrying 3–5 connected-component SKUs as a halo to the rest of the accessories range. The Trek CarBack Radar Tail Light (launched April 2024 with 77GHz radar) and the Garmin Varia line are the premium benchmarks; mid-price alternatives from Chinese OEMs now sit in the $35–80 wholesale price band and still carry 30%+ wholesale margins. FindMy-compatible accessories should be marketed using the safe phrase “compatible with Apple FindMy” — only MFi-licensee products may carry Apple’s official certification phrasing, and unauthorized use of such language is a trademark risk.
5. Risks: Inventory Lock-Up, Category Over-Saturation, and Channel Conflict
The case for accessories sounds clean in isolation. In practice, three risks can erode the margin advantage if the sourcing plan is built without guardrails: inventory lock-up when the SKU count expands too fast, category over-saturation when every competitor chases the same sub-category, and channel conflict when e-commerce and the storefront fight over the same retail price.
5.1 Risk 1: Inventory lock-up from rapid SKU expansion
A wholesaler that moves from 200 SKUs to 800 SKUs in nine months must hold roughly the same dollar inventory in absolute terms (because each new SKU is held in smaller quantities), but the working-capital cycle stretches because some of the new SKUs will not turn at the planned rate. The 2024–2025 inventory write-downs at Giant and Canyon are a warning: even with the best forecasts, 5–10% of new SKUs will sit for 12+ months. The defense is a 90-day “fast-fail” review — every new SKU is reviewed at 90 days, and any SKU below 30% of plan gets discontinued or marked down. Without that review, a doubling of SKU count can quietly double the working-capital commitment while only adding 60–80% of the planned revenue.
5.2 Risk 2: Category over-saturation
The accessories categories that look most attractive in the 2025 market data are also the categories where competition is most intense. Bells, basic lights, and bottle cages are now supplied by 300+ Chinese factories; the wholesale margin on a basic aluminum bell has compressed from 35–40% in 2018 to 20–25% in 2026 because of factory-side competition. The over-saturation risk is real for any wholesaler who treats accessories as a “drop-ship” category without a category-selection framework. The defense is to choose 2–3 sub-categories to specialize in (e.g., connected lights, FindMy-compatible locks, premium bottle cages for e-bikes) and go deep rather than wide. Specialty depth in 2–3 sub-categories beats commodity breadth in 20.
5.3 Risk 3: Channel conflict between e-commerce and the storefront
The fastest-growing sales channel for cycling in 2026 is e-commerce (Mordor Intelligence projects online retail at 13.31% CAGR through 2031, well above the 4–5% growth in offline retail), and the U.S. Census Q3 2025 data puts e-commerce at 16.4% of total retail sales — but for cycling specifically, the offline channel still dominates (Mordor’s 2025 figure: offline 80.61%). A wholesaler that sells to both channels has to manage price discipline carefully: the storefront dealer will not stock a SKU that the same wholesaler undercuts on their own DTC site. The defense is a clear channel-pricing policy — typically a 10–15% premium on the DTC channel versus the wholesale channel, structured so the storefront dealer’s retail margin stays above the 37% break-even point the NBDA has documented as the specialty bike retailer average.
6. 2026–2028 Forecast for Cycling Accessories vs Complete Bikes
The 2026–2028 outlook reinforces the case for accessory-mix expansion. Three forecast trends matter: accessories continue to grow faster than bikes, e-bike accessories pull the whole accessories category upward, and tariff / regulatory dynamics continue to compress complete-bike margins while leaving accessories relatively protected.
6.1 Accessories: 6–8% CAGR through 2028
The accessory-market consensus forecast from three independent sources for 2026–2028:
- The Business Research Company: bicycle accessories market growing from $15.19B (2025) to $22.26B (2030) at 8.1% CAGR.
- Fortune Business Insights: bicycle accessories market growing from $16.33B (2026) to $24.73B (2034) at 5.3% CAGR.
- Persistence Market Research: bicycle accessories market growing from $19.7B (2026) to $30.9B (2033) at 6.7% CAGR.
The reasonable 2026–2028 forecast is 6–8% CAGR. The U.S. accessories market specifically tracks at 7.7% CAGR through 2030 (Grand View Research). E-bike accessories, the fastest-growing segment, is forecast at 7.6% CAGR through 2035 (WiseGuyReports).
6.2 Complete bikes: 4–7% CAGR through 2028 (with margin compression)
The complete-bike market consensus for 2026–2028 is materially slower. Fortune Business Insights puts the bicycle market at 4.8% CAGR; Mordor Intelligence puts it at 10.35% CAGR but only when e-bikes and premium segments are included. The conventional segment, which is what most IBDs and wholesale distributors actually sell, is forecast at roughly 4% CAGR. The margin outlook is more challenging: tariff exposure remains a 5–12% cost-base addition, inventory normalization (post-2024–2025 glut) continues through 2027, and dealer terms from major brands are tightening. The 2026–2028 reasonable forecast for complete-bike wholesale margin is 7–10% (vs 8–12% in 2024), not because the market shrinks but because the cost base rises.
6.3 The wholesale buyer’s 2026–2028 action
For a wholesale buyer building a 2026–2028 sourcing plan, the math is straightforward: allocate 60–70% of new working capital to cycling accessories (split roughly 55–60% to components, 20–25% to apparel, 15–20% to connected electronics), and 30–40% to complete bikes. That ratio is materially different from the 2022–2024 typical split (50/50 or 45/55 in favor of complete bikes) and reflects the post-tariff, post-glut, post-e-bike-boom reality of the channel. Specific category decisions within accessories should follow the 2025 sub-category share data (68.30% components, market.us) and the 2026 fastest-growth segments (radar tail lights, FindMy-compatible locks, GPS-enabled accessories for e-bikes).
Comparison Table — Complete Bikes vs Cycling Accessories (Wholesale Buyer View)
The six dimensions a sourcing team should compare side-by-side. The figures are 2025–2026 reference ranges for the North American and European wholesale channel, drawn from NBDA Profitability Project benchmarks, Fortune Business Insights, TBRC, Grand View Research, market.us, Circana 2024 Outdoor Retail Sales Trends, and AnttifySport landed-cost modeling.
Bottom line for sourcing teams
The 2026–2028 cycling wholesale market is a story of two categories: complete bikes, where margin is compressing and inventory risk is rising, and accessories, where margin is structurally wider, turnover is faster, and the consumer tailwind (e-bike adoption, lighting regulation, connected-component ecosystems) is still building. For the wholesale buyer, the practical 2026 sourcing plan is:
- Re-allocate working capital toward accessories. Target a 60–70% accessories / 30–40% complete-bike split for new 2026 capital deployment. Move from 200–400 SKUs to 800–1,200 SKUs over two buying cycles.
- Specialize within accessories. Choose 2–3 sub-categories (connected lights, FindMy-compatible locks, premium bottle cages, e-bike-specific accessories) and go deep rather than broad across all 20 sub-categories.
- Use the 90-day fast-fail review. Every new SKU gets reviewed at 90 days; anything below 30% of plan is discontinued or marked down. Without this guardrail, SKU expansion doubles working-capital risk while adding only 60–80% of planned revenue.
- Build one private-label hero line. A focused 5–10 SKU private-label launch in a single category (bells + lights, or bottle cages + accessories) can carry 35–45% wholesale margin versus 20–30% for the branded equivalent.
- Match the 2026–2028 forecast mix. Components will dominate at 68% of accessories revenue; connected electronics will be the fastest-growing sub-segment; tariff and inventory dynamics will keep complete-bike wholesale margins compressed at 7–10%.
Verify all margin, market-size, and growth figures against your specific SKU mix, channel structure, freight lane, and HTS classification before finalizing the sourcing plan. The spreads cited above are 2025–2026 reference values for the North American and European wholesale channels; specialty, DTC, and emerging-market channels can move the numbers materially.
About the Author
The AnttifySport Cycling Sourcing Intelligence team covers category-level margin, landed-cost, and channel-mix analysis for cycling brands, IBDs, and wholesale distributors across North America, Europe, and Asia-Pacific. The team’s work focuses on the practical math behind sourcing decisions — the freight lanes, the HTS classifications, the MOQ trends, the dealer-term structures, and the channel-conflict dynamics that translate market data into a buyable SKU plan. The team’s analysis is grounded in AnttifySport’s 2018-to-present landed-cost modeling database for cycling, camping, hiking, and skiing categories and in public industry benchmarks from NBDA, Circana, Fortune Business Insights, The Business Research Company, Grand View Research, market.us, and the Outdoor Industry Association.
For questions on a specific cycling-accessories sourcing plan or to talk through a private-label launch, reach out at https://www.anttifysport.com/contact/.
Further reading & sources
- Fortune Business Insights — Bicycle Market Size, Share | Industry Report 2026–2034 — global complete-bicycle market baseline at $33.87B (2025) growing to $52.19B (2034) at 4.8% CAGR.
- The Business Research Company — Bicycle Accessories Market Size and Forecast Report 2026–2030 — bicycle accessories market at $15.19B (2025) growing to $22.26B (2030) at 8.1% CAGR.
- Grand View Research — U.S. Bicycle Accessories Market Size & Trends Report 2030 — U.S. bicycle accessories market at $2.1B (2023) growing at 7.7% CAGR through 2030.
- Fortune Business Insights — Bicycle Accessories Market Size, Share | Growth Forecast 2026–2034 — bicycle accessories market at $16.33B (2026) growing to $24.73B (2034) at 5.3% CAGR.
- Persistence Market Research — Bicycle Accessories Market Size, Share & Analysis 2033 — bicycle accessories market at $19.7B (2026) growing to $30.9B (2033) at 6.7% CAGR, with BPSA 2024 figures on $380 e-bike-owner vs $165 conventional-bike-owner accessories spend.
- market.us — Bicycle Accessories Market Size, Share | CAGR of 6.7% — 2025 sub-category share: components 68.30% of accessories market; forecast $15.1B (2025) → $28.7B (2035).
- National Bicycle Dealers Association — Margins and Pricing: How To Run a Profitable Bike Shop in 2020 and Beyond — 37% retail break-even benchmark; realized-margin concept; pricing structure analysis.
- Bicycle Retailer — Fred Clements: A Formula for High-Profit Bike Stores (June 2013, NBDA Profitability Project) — 36% gross margin on bikes and 47–48% maintained margin on P&A across both average and high-profit stores.
- Circana — US Outdoor Sports Retail Performance Awards 2024 — 2024 outdoor retail tracking: Accessories category fastest-growing with 11% YoY; cycling category declined.
- Outdoor Industry Association — Executive Summary: 2025 Outdoor Retail Sales Trends Report — $28B total U.S. outdoor market in 2024; footwear + accessories strongest gains; equipment declined.
- Outdoor Industry Association — Outdoor Participation Hits Record Levels for Ninth Consecutive Year — 175.8M U.S. outdoor participants in 2023; foundational demand backdrop for cycling accessories.
- road.cc — Bike Industry Challenges Continue as Giant and Canyon Profits Down 66% and 30% — Giant FY2024 net profit down 62.8%; Canyon down 30%; Shimano downgraded 2025 outlook.
- Workstand — What the Data Says About the State of the Bike Industry — 2025 IBD unit sales -4% YoY; e-commerce +13%; average online order value $458 (up from $427 in 2024).
- Show Daily — U.S. Retailer Outlook: Bike Shops Face Four Brutal Truths and One Big Question (July 2025) — 60% recommended service gross margin; 50% gross margin on previously owned bikes; the 2025 IBD profitability context.
- Fit Werx — How You Help Specialty Bike Shops Stay in Business — category-level margin breakdown: tubes 40–60%, Shimano 28–35%, Garmin 25–29%, Shimano Ultegra GS rear derailleur 28–36%.
- WiseGuyReports — E-Bike Accessories Market Trends 2035 — e-bike accessories market at $2.64B (2025) growing to $5.5B (2035) at 7.6% CAGR.
- Mordor Intelligence — Bicycle Market Size, Share & 2031 Growth Report — global bicycle market $83.5B (2025) → $150.8B (2031) at 10.35% CAGR; e-bikes 50.74% of value; online retail growing 13.31% CAGR.
- U.S. Census Bureau — Quarterly E-Commerce Report — Q3 2025 e-commerce at 16.4% of total U.S. retail sales; structural channel-shift backdrop.
This article is for informational and educational purposes only and does not constitute a binding quote, certification, or commercial offer. Wholesale-margin, retail-margin, market-size, growth-rate, and tariff figures cited are 2025–2026 reference values drawn from public industry sources including Fortune Business Insights, The Business Research Company, Grand View Research, market.us, Persistence Market Research, the National Bicycle Dealers Association, Circana’s 2024 Outdoor Retail Sales Trends Report, the Outdoor Industry Association, and AnttifySport’s internal landed-cost modeling for cycling categories. Actual margins and market sizes vary materially by SKU, HTS classification, freight lane, channel mix, customer concentration, retailer operating-cost structure, and tariff regime. Wholesale buyers and brand sourcing teams should verify all margin, market-size, and tariff figures against current factory quote sheets, freight forwarder rate sheets, customs rulings, and channel-specific P&L data before committing to a sourcing plan. AnttifySport is not liable for commercial decisions made on the basis of this article.
Related Products from AnttifySport
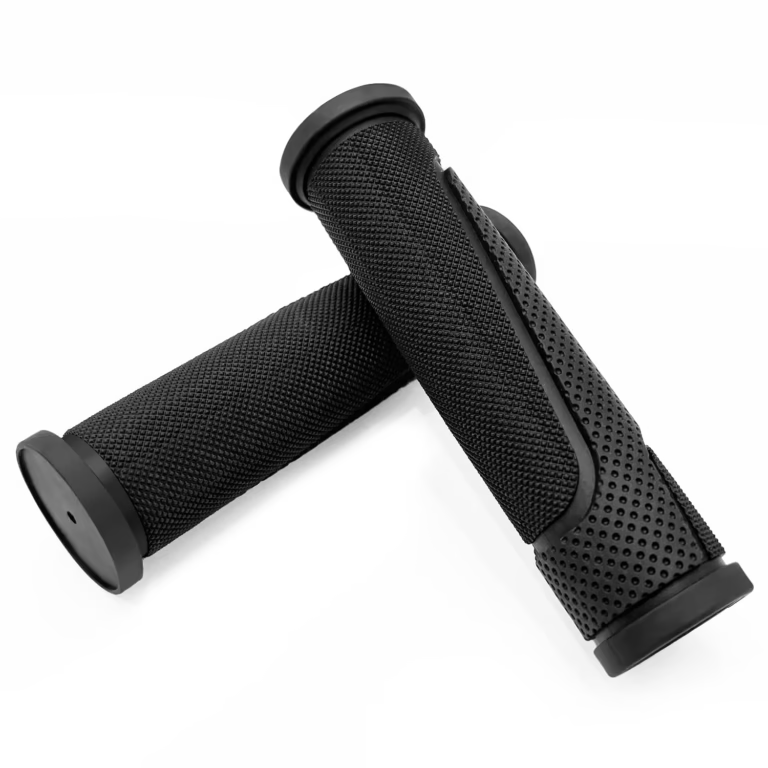
Browse the AnttifySport catalog for cycling accessories covered in this article. All products shown here are part of our wholesale lineup — wholesale pricing, low MOQ, and OEM/ODM support available. Contact our team for quotes.