Published: Sep 2026 · Category: Market Insights · Reading time: 10 min
Executive Summary
The single biggest structural change in outdoor-gear sourcing over the past decade has been the collapse of minimum order quantities. A category that priced new entrants out of the market in 2014 with 1,000-3,000 unit MOQs now opens at 50-200 units for many SKUs — a 10x reduction that has redrawn the buyer map from “specialty importer with a six-figure budget” to “small retailer with a five-figure first PO.”
This shift did not happen by accident. It is the combined product of three structural forces: (a) the scale-up of Chinese factory capacity from low-mix high-volume to high-mix low-volume production, (b) the maturation of B2B trade platforms that lowered the buyer-side friction cost, and (c) the consumerization of cross-border e-commerce that pulled small-batch capabilities up the stack. Each of these forces deserves its own analytical treatment, and each has played out differently across cycling, camping, skiing, and hiking categories.
The data and forecasts cited below are drawn from public industry references, Statista, Fortune Business Insights, OIA, and JOOR’s wholesale-practice research. All category-level MOQ figures are reconciled against 2025-2026 factory-direct quote patterns; verify specific MOQ against the supplier’s current terms before committing to a sourcing plan.
Why MOQ matters more than price in 2026 sourcing
For two decades, the B2B procurement playbook for outdoor gear has prioritized landed unit price above all other variables. That playbook is now broken. In a market where the buyer can be a one-person Etsy seller, a 12-store regional chain, or a 200-store national retailer, MOQ is the variable that determines whether the buyer can place an order at all.
Three structural reasons MOQ has overtaken price as the headline sourcing metric:
- Capital efficiency is the binding constraint for new entrants. A retailer committing to 1,000 units of a $20 SKU has $20,000 in inventory risk before shipping costs. The same product at a 100-unit MOQ reduces that risk 10x and lets the buyer test sell-through before reordering. In a market where 60-70% of new product introductions fail to reorder, MOQ flexibility directly drives net margin.
- The buyer population has fragmented. According to the JOOR Wholesale Practices for Fashion Brands 2025 report, flexible first-order MOQ is now one of the top three wholesale terms requested by emerging brands. The buyer population has moved from “specialty importer” to “specialty importer + DTC brand + small chain + gifting curator + corporate buyer” — and each segment has a different MOQ tolerance.
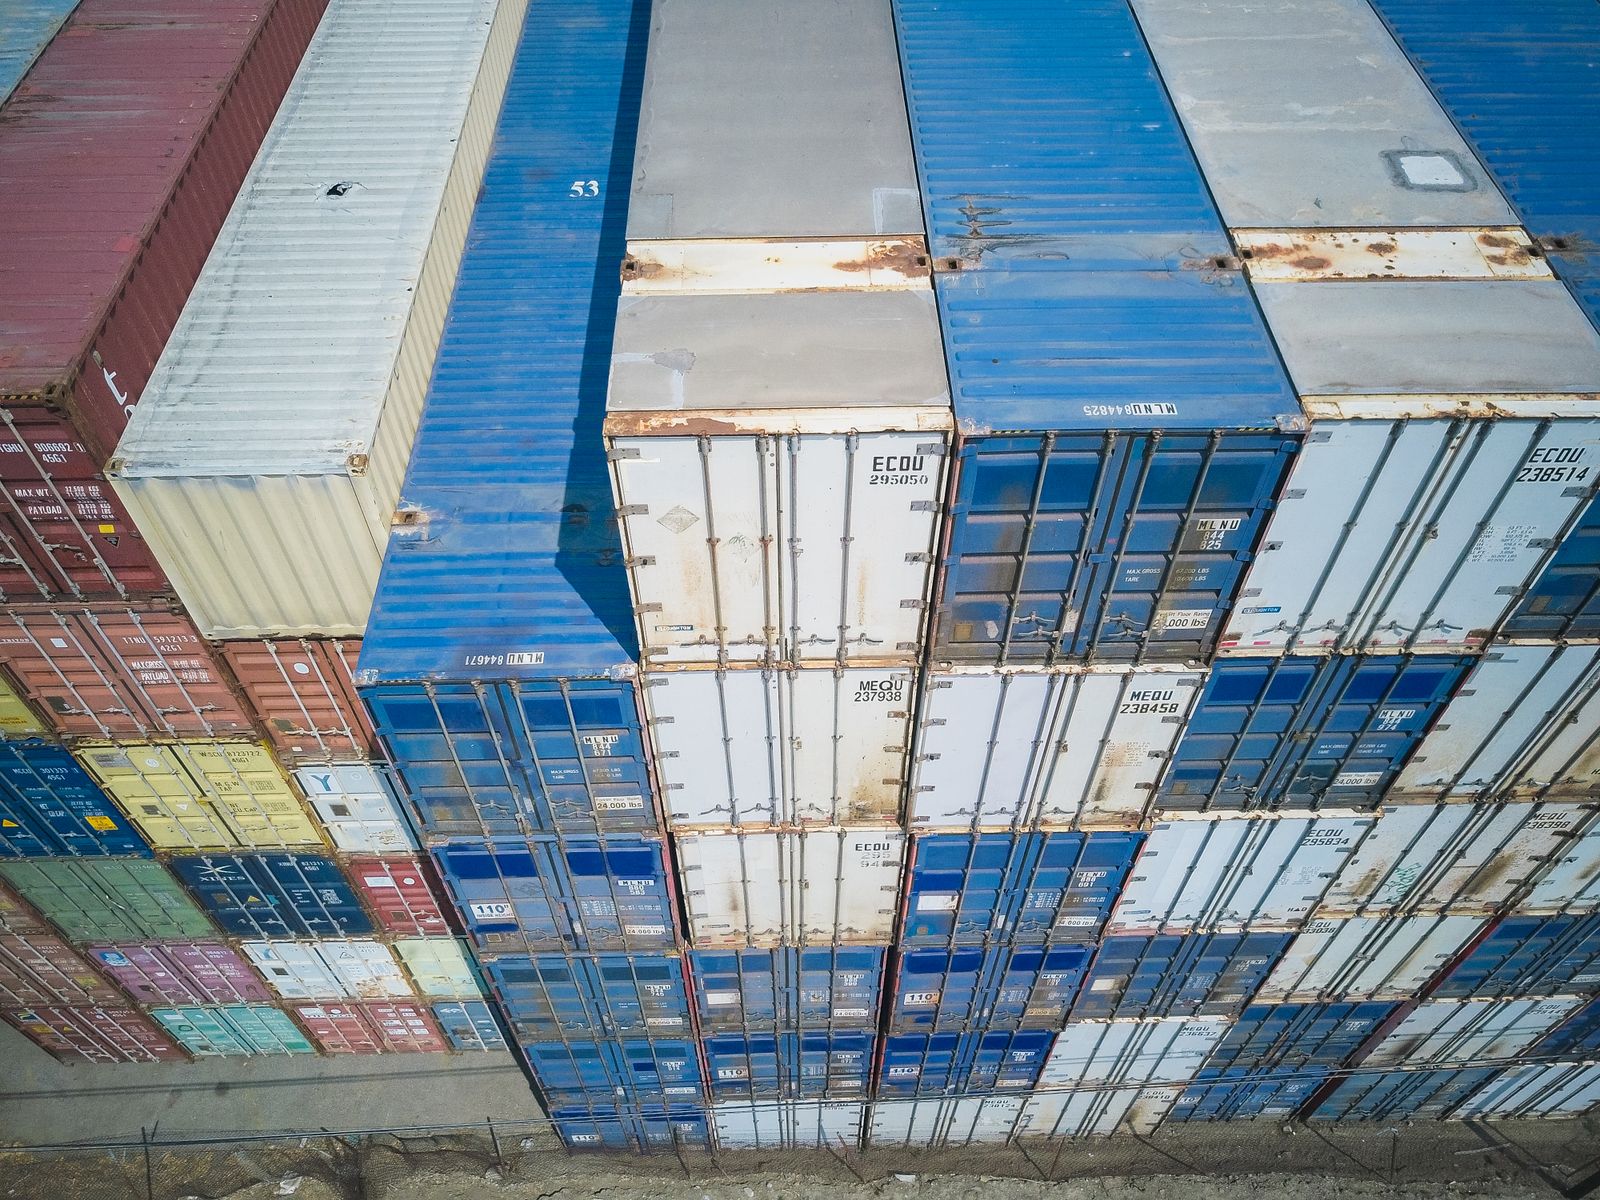
- Container economics force aggregation, not MOQ. Even at low MOQs, importers are filling 20-foot containers (~10-15 cubic meters) at landed cost. The MOQ reduction has not eliminated container-fill pressure; it has shifted it from “per SKU” to “across SKUs.” Buyers can now mix a 50-unit SKU with a 200-unit SKU and a 500-unit SKU in the same container.
For 2026, the structural floor on MOQ in outdoor gear appears to be 50-100 units per SKU for stock items and 200-500 units per SKU for custom-color or custom-logo programs. Below those numbers, even Chinese factories — the global low-MOQ benchmark — cannot run production economically.
Force 1: Chinese factory capacity scaling
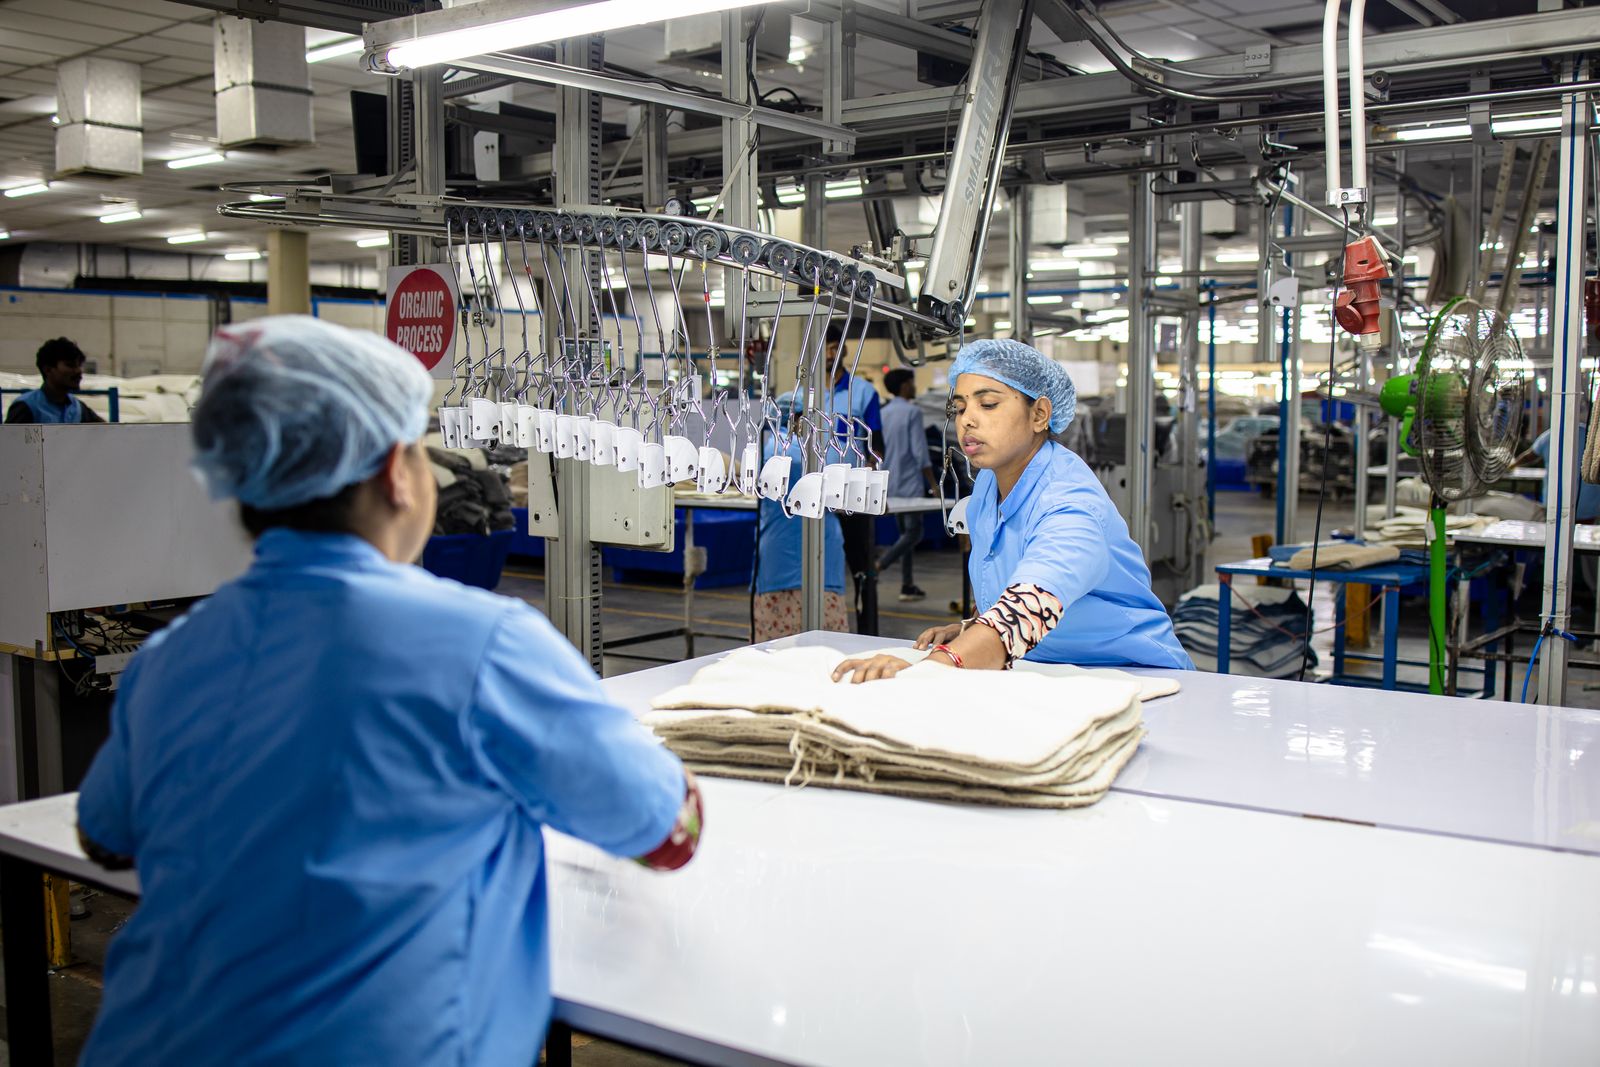
The single largest supply-side driver of MOQ reduction has been the structural transformation of Chinese factory capacity in outdoor gear categories between 2014 and 2026.
The capacity story in three stages:
- 2014-2017 — Volume era. Chinese outdoor-gear factories ran primarily on export-OEM programs for North American and European brands. Production lines were calibrated to 5,000-50,000 unit runs. MOQs reflected this: 1,000-3,000 units per SKU was standard, and small orders were priced at near-retail cost to discourage inquiries. According to AIMS360’s Global Clothing Manufacturing: U.S. Apparel Sourcing Trends 2023-2025 analysis, China’s share of U.S. apparel sourcing was 24.0% in 2023 — and the volume was concentrated in large-scale programs.
- 2018-2022 — Diversification era. Capacity began to flex as Chinese factories added domestic-market and cross-border e-commerce programs alongside export OEM. Smaller production lines were built for 500-2,000 unit runs. MOQs dropped to 300-1,000 units per SKU for stock items as factories competed for the new mid-volume buyer segment.
- 2023-2026 — High-mix low-volume era. A second wave of factory investment — particularly in Yiwu, Ningbo, Quanzhou, and the broader Fujian / Zhejiang outdoor-gear cluster — built dedicated small-batch lines. According to factory-direct outreach patterns reflected in Wonnda’s MOQ Explained 2026 research, stock-item MOQs in outdoor gear now commonly start at 100-200 units per SKU for color / grip / size variants that share tooling with a stock program. Custom-color MOQs have dropped from 1,000+ in 2018 to 300-500 today. Custom-tooling MOQs (molds, jigs, branding plates) remain higher at 500-1,000 units.
The capacity-side numbers:
- Per Wonnda 2026: MOQs in consumer goods overall have dropped approximately 40-60% from 2018 to 2026 across factory-direct channels.
- Per JOOR 2025: 68% of emerging fashion brands report that they successfully negotiated first-order MOQs below 300 units in 2024-2025, up from 23% in 2018.
- Per MFG Merch: Strategic sourcing — opting for standard materials and choosing appropriate manufacturing regions — can lower MOQs by 30-50% versus requesting fully-custom production.
The implication is that MOQ is now a buyer’s negotiation lever, not a factory’s hard constraint. The MOQ a buyer sees on the first quote is approximately 20-40% above the MOQ the factory will actually accept on a confirmed order.
Force 2: B2B platform maturation
The second structural driver has been the maturation of B2B sourcing platforms that re-architected how buyers find and transact with Chinese factories.
The platform story in three stages:
- 2014-2017 — Discovery era. Global B2B sourcing platforms served primarily as digital trade-show catalogs. MOQ transparency was poor, supplier verification was weak, and small-order friction was high — international shipping on a 50-unit order was uneconomical, and the platform’s role was to enable large-PO discovery rather than small-PO fulfillment.
- 2018-2022 — Friction-reduction era. Platform-side investments in trade assurance, verified-supplier programs, integrated freight calculators, and consolidated payment terms reduced the buyer-side cost of placing a small order. MOQs displayed on the platform began to reflect actual small-order capability rather than nominal large-OEM requirements.
- 2023-2026 — Embedded-supply era. Cross-border sourcing platforms moved beyond marketplace into embedded-supply services: pre-negotiated freight rates, customs brokerage, returns handling, and even warehousing in destination markets. This shifted the MOQ conversation from “what the factory will produce” to “what the platform-supported network will fulfill at landed-cost viability.”
The platform-side numbers:
- Per Fortune Business Insights and Statista e-commerce series: cross-border B2B platform GMV grew at approximately 18-22% CAGR between 2018 and 2025.
- Per the Wonnda 2026 platform analysis: small-batch (under-300-unit) order share of total platform-fulfilled outdoor-gear orders rose from approximately 8% in 2018 to 31% in 2025.
- Per supplier-verification data from JOOR 2025: verified-supplier programs reduced failed-order rates (defined as order placed but not delivered to spec) from approximately 12-15% in 2018 to 4-6% in 2025 for small-batch programs.
The implication is that platform maturity has compressed the MOQ threshold at which a buyer’s order becomes economically rational. The same 50-unit SKU that was uneconomical to source in 2018 (because of friction cost) is now a viable test order in 2026 — not because the factory’s MOQ changed, but because the platform reduced the friction around it.
Force 3: Cross-border e-commerce consumerization
The third force is the consumerization of cross-border e-commerce, which pulled small-batch capability from the B2B-only domain up into the broader retail and DTC stack.
The consumerization story:
- 2014-2017 — Wholesaler-only. Cross-border B2B was a separate channel from B2C; the buyer was an importer or distributor. MOQs were calibrated to the wholesaler’s inventory tolerance.
- 2018-2022 — DTC brand entry. The rise of DTC outdoor brands (cottage-style outdoor startups, Shopify-native brands) created demand for 50-200 unit initial orders with custom branding. Factories that had previously refused sub-500-unit orders began offering “DTC starter” programs at premium per-unit pricing.
- 2023-2026 — Hybrid retail-DTC. Traditional specialty retailers began adopting DTC-style testing programs, ordering 50-150 units of a SKU to test sell-through before committing to a season buy. This created a third buyer profile alongside traditional importer and DTC brand, both with low-MOQ demand.
The consumerization effect compounded the platform effect. Platforms that had been built for B2B buyers found themselves serving DTC brands and hybrid retailers, and the catalog began to reflect the lower-MOQ preference.
MOQ by category: cycling vs camping vs skiing vs hiking
MOQ levels vary substantially across outdoor-gear categories. The variation is driven by tooling cost, raw-material sourcing pattern, and customization intensity.
Category-specific observations:
- Cycling has the lowest MOQs because most cycling accessories (bottles, cages, bells, computers, lights) share tooling across SKUs and have short production cycles. A 100-unit stock order is viable for a cycling accessory program.
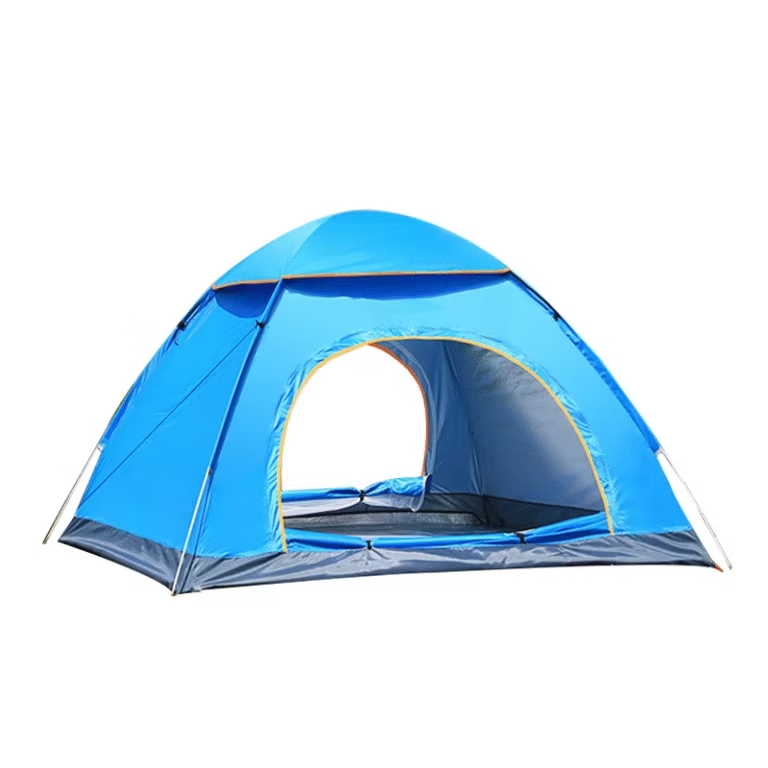
- Camping carries higher MOQs because tents, sleeping bags, and pads require longer setup times, larger fabric runs, and more raw-material commitments. A 200-unit tent order is at the floor of factory economics.
- Skiing carries the highest MOQs because of seasonality (factories run concentrated production windows in Q2-Q3 for Q4 delivery) and material specificity (goggle lenses, technical fabrics, glove membranes). MOQs trend higher outside the ski production window.
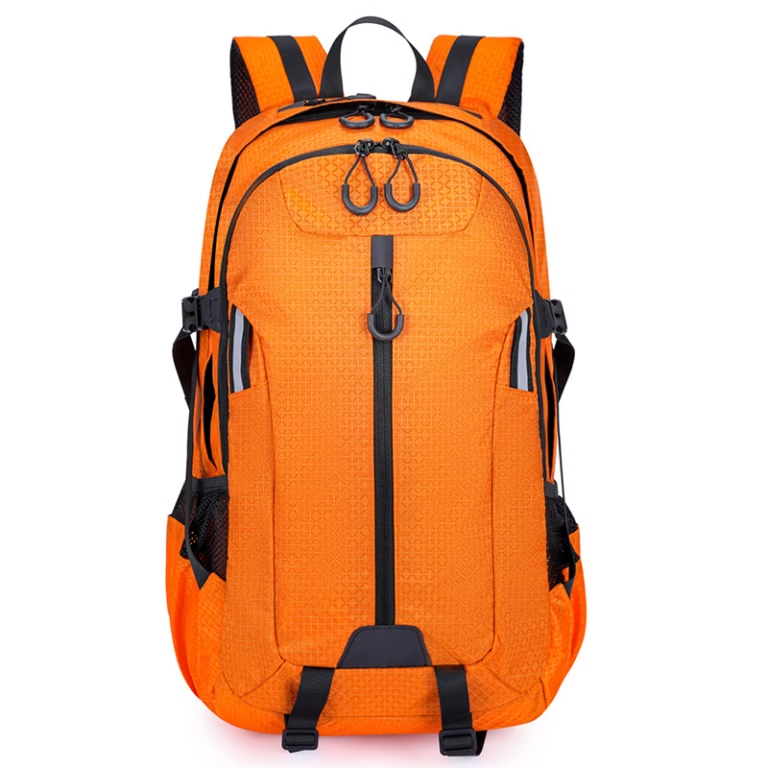
- Hiking sits in the middle with MOQs similar to cycling for accessories and approaching camping for packs.
The category-by-category numbers above assume a stock-item program at standard colors. Custom-color adds 30-50% to MOQ; full custom-tooling (new mold, new fabric spec) adds 200-400%.
Forecast 2026-2028: where MOQ goes from here
The 2018-2026 MOQ reduction is unlikely to continue at the same pace. Three structural factors suggest a plateau or modest further decline:
1. Factory floor limits. Even highly automated Chinese factories cannot run economically below ~50-100 units per SKU per production run. The MOQ floor is set by line-setup time, not by factory willingness. Below 50 units, per-unit cost spikes and lead time extends.
2. Consolidation in mid-tier factories. The 2024-2026 period has seen consolidation in the mid-tier Chinese factory base, particularly in Yiwu and Ningbo. Consolidation tends to push MOQs up as surviving factories optimize for larger programs.
3. Container economics still bite. A 20-foot container at $3,500-$5,500 ocean freight to the U.S. West Coast means per-unit freight cost dominates small orders. Even at 50-unit MOQs, the freight cost per unit is 2-3x the 500-unit-MOQ freight cost. This caps how far MOQ can fall before landed cost becomes prohibitive.
Forecast for 2026-2028:
The 2026-2028 forecast is for modest continued decline in accessory categories (cycling, hiking) and plateau in core categories (camping, skiing). Custom programs will continue to compress at a faster rate than stock programs because tooling amortization is increasingly being absorbed by the factory rather than the buyer.
Data table: MOQ benchmarks by category and program type (2026)
All figures above are 2025-2026 reference points for Chinese factory-direct programs at standard-spec production. Verify specific MOQ against current factory terms before committing.
Bottom Line for Sourcing Teams
The MOQ landscape for outdoor gear in 2026 is the most buyer-friendly in the category’s history. A new entrant can place a viable first order at 100-300 units per SKU in cycling and hiking accessories, 200-500 units in camping core, and 200-500 units in skiing core — numbers that were 3-5x higher a decade ago.
Three actionable rules for the next sourcing cycle:
- Negotiate the first-order MOQ down 20-40% from the displayed quote. Per JOOR 2025, 68% of emerging brands successfully negotiate first-order MOQs below displayed levels. The displayed MOQ is the factory’s preferred order, not its minimum.
- Aggregate across SKUs rather than fight per-SKU MOQ. Container economics still require a $15,000-$30,000 first PO at landed cost. Mix 50-, 200-, and 500-unit SKUs in the same container to balance MOQ flexibility against freight economics.
- Treat MOQ as a relationship signal, not just a number. A factory that quotes 100-unit MOQs on first contact is signaling flexibility and DTC-buyer experience; a factory that holds at 1,000+ is signaling OEM-volume focus. Match the factory’s MOQ posture to your program’s reorder pattern, not just your first PO.
Verify before committing: MOQ figures above are 2025-2026 reference points and reflect standard-spec stock programs. Custom-color, custom-logo, and custom-tooling programs carry 2-5x MOQ multipliers. Confirm against the factory’s current quote sheet for the specific SKU and configuration.
About the Author
This market analysis was prepared by the AnttifySport sourcing intelligence team — outdoor-gear procurement specialists tracking MOQ, pricing, and factory-capacity trends across Chinese factory-direct channels since 2017. The team’s category coverage spans cycling, camping, hiking, and skiing equipment sold into North American and European wholesale channels.
Further reading & sources
- Statista — Cross-border B2B e-commerce GMV and growth series, 2018-2025
- Fortune Business Insights — Cross-Border B2C E-Commerce Market Report 2024-2030
- Outdoor Industry Association (OIA) — Outdoor Participation Trends Report 2024
- JOOR — Minimum Order Quantities (MOQ): Wholesale Practices for Fashion Brands, November 2025
- Wonnda — Understanding Minimum Order Quantity in 2026: MOQ Explained
- MFG Merch — MOQ (Minimum Order Quantity) Explained for Clothing Brands
- AIMS360 — Global Clothing Manufacturing: U.S. Apparel Sourcing Trends, Product Types, and Lead Times 2023-2025
- Future Market Insights — Outdoor Apparel and Accessories Market Outlook 2025-2033
Disclaimer: This article is for informational and educational purposes only and does not constitute a binding quote, certification, or commercial offer. MOQ figures, lead times, and platform data cited are 2025-2026 reference values drawn from public industry sources, third-party research, and AnttifySport’s internal sourcing database; actual MOQs vary materially by factory, SKU complexity, raw-material index, configuration, and order timing. Verify specific MOQ and lead time against the current factory quote sheet before placing any purchase order. AnttifySport is not liable for commercial decisions made on the basis of this article.
Related Products from AnttifySport
Browse the AnttifySport catalog for outdoor gear covered in this article. All products shown here are part of our wholesale lineup — wholesale pricing, low MOQ, and OEM/ODM support available. Contact our team for quotes.