Published: Sep 2026 · Category: B2B Buying Guide · Reading time: 12 min
Executive Summary
Container consolidation is the single largest cost lever in outdoor gear importing, and most wholesale buyers under-optimize it by treating it as a freight decision rather than a sourcing decision. A 40-foot HQ container holds roughly 60 cubic meters of usable volume — enough for 3,000 to 8,000 units of typical outdoor gear depending on size and packaging. Whether that container is filled with one factory’s product or consolidated from three, four, or six factories changes per-unit landed cost by 20-40% and changes customs documentation complexity by a similar factor.
This guide covers the four consolidation strategies available to 2026 importers, the FCL vs LCL decision matrix that decides which strategy to use, the container utilization calculation that exposes hidden inefficiency, the cargo mix patterns (cycling + camping, ski + hiking) that work in mixed SKUs, and the freight cost breakdown that separates negotiable from non-negotiable components. The 2026 Trans-Pacific rate environment is included with specific September 2026 numbers.
The figures cited are drawn from public industry references and current freight-rate publications. Verify specific rate quotes and customs requirements against your forwarder’s current rate sheet and the destination country’s customs authority before finalizing logistics decisions.
Why consolidation strategy matters more than FOB price
Most wholesale buyers ask the wrong first question on logistics. They focus on per-unit FOB price. FOB price matters for unit economics, but the dominant variable for total landed cost is how efficiently the buyer fills containers and consolidates supplier shipments. Four variables drive roughly 80% of total-cost decisions:
- Container utilization rate — the percentage of usable container volume actually filled; less than 80% indicates inefficient consolidation and wasted freight cost per unit.
- Number of supplier factories per shipment — each additional supplier adds documentation, quality-control overhead, and consolidation handling fees.
- Production-to-shipment lead time — the time between final QC and port loading; longer lead times require more warehousing and tie up working capital.
- Documentation complexity — the number of customs documents per shipment; consolidation reduces total document count but increases per-document complexity.
For 2026 importers, this means a $0.50 lower per-unit FOB price from a smaller factory often produces a $2-3 higher per-unit landed cost after consolidation inefficiencies. The factory with the best unit price is rarely the lowest total-cost option. Container consolidation is where the gap between best-FOB and lowest-landed actually lives.
FCL vs LCL: the decision matrix
FCL (Full Container Load) and LCL (Less than Container Load) are not interchangeable. Each suits a specific volume profile, and choosing the wrong one adds 15-30% to per-unit landed cost on the same product.
The crossover point is roughly 15 CBM. Below 15 CBM, LCL is usually the right answer despite higher per-CBM cost because the FCL alternative underfills the container by 50%+ — wasting 50% of the freight cost on unused space. Above 15 CBM, FCL becomes competitive and pulls ahead decisively above 25 CBM.
For 2026 importers, the practical rule is: if your order is below 15 CBM, ship LCL or consolidate with another buyer’s goods. If it is between 15 and 25 CBM, run the math both ways using your forwarder’s current quote. Above 25 CBM, default to FCL.
Container utilization rate calculation
Container utilization rate (CUR) is the single most useful metric for measuring consolidation efficiency. It is also the metric most buyers never calculate.
Formula:
“`
CUR = (Actual loaded CBM) / (Container nominal CBM) × 100%
“`
Reference volumes (nominal):
Example calculation:
A buyer fills a 40HQ container with mixed outdoor gear (water bottles, packs, tents). The order totals 48 CBM of packed product on a 76 CBM container. CUR = 48 / 76 = 63%. At a freight cost of $7,500 for the 40HQ, the buyer is paying $156.25 per CBM for freight on what is shipped, but the cost of the unused 28 CBM is also spread across the loaded units — adding roughly $0.58 per unit of product cost. Above 80% CUR, that wasted-space penalty drops to under $0.20 per unit.
Target CUR:
- Excellent: 85-95% (typical for full-factory-load orders with optimized packaging)
- Acceptable: 75-85% (typical for mixed-SKU consolidation with one or two SKUs in low quantity)
- Wasted: below 70% (typical of buyers who add “one more small SKU” without recalculating space)
CUR is also a useful negotiation lever. A forwarder who quotes a flat FCL rate is indifferent to your CUR; a forwarder who quotes per-CBM should be challenged if your CUR is below 70% — they are charging you for space you are not using, then reselling that space to another buyer.
Cargo mix strategies for mixed-SKU consolidation
Mixed-SKU consolidation is where most 2026 importers can save 15-25% on landed cost. The principle is straightforward: pair a high-density SKU (water bottles, small accessories) with a low-density SKU (tents, packs) so the container’s weight limit and volume limit are reached at roughly the same time.
Common cargo mix pairings that work in outdoor gear:
Mix-pairing rules:
- Match shipping seasons — pairing Q4 camping stock with Q1 ski accessories works because the same buyer is receiving both for the same season’s floor set. Pairing across seasons creates warehousing cost that erases the freight saving.
- Match packaging dimensions — pallet-friendly SKUs (24-bottle cartons, 12-pack accessory boxes) stack more predictably than irregular shapes (folded tents, rolled sleeping bags). The less your SKUs match in dimension, the lower your CUR.
- Match compliance documentation — FDA + LFGB bottles mixed with Prop 65 metal accessories clean customs faster than Prop 65 metal mixed with REACH textiles; mismatched compliance documentation triggers port-state inspection.
- Limit suppliers per container — six suppliers per container is the practical maximum; above eight, the documentation overhead exceeds the freight saving.
Freight cost breakdown — September 2026 Trans-Pacific
The 2026 Trans-Pacific market is volatile. September 2026 published rates, per Sino-Shipping’s monthly update, show:
These are indicative ranges with 2-3 week quote validity. Surcharges vary by carrier, route, and equipment availability.
Total landed cost stack for a 40HQ consolidation (illustrative):
Negotiable vs non-negotiable components:
- Negotiable: ocean freight base rate, origin THC, destination THC, drayage rate, broker fees, insurance rate, warehousing rate
- Non-negotiable: customs duty (set by HTS code), MPF (statutory), HMF (statutory)
For most 2026 importers, the negotiable components total $9,000-$13,000 per 40HQ. A 10-15% reduction in those components is achievable through competitive quoting — typically $1,000-$2,000 saved per shipment. The non-negotiable components are fixed once the HTS classification is locked in.
Customs clearance pre-checks for US and EU destinations
Customs clearance failures cost more than delays. A held shipment accumulates demurrage (port storage) and detention (container rental beyond free days) at $75-$200/day after a 4-7 day free period. Pre-clearance checks take 24-48 hours and prevent most holds.
United States (CBP) pre-checks:
European Union pre-checks:
Practical rule for 2026 importers: before the first PO to a new supplier, request a complete document checklist from your customs broker for both US and EU destinations. Confirm the broker has handled outdoor gear in your HS code range in the last 90 days. A broker who primarily handles electronics will not know the FDA Prior Notice rules for water bottles.
Bottom line for sourcing teams
Container consolidation is a sourcing decision, not a freight decision. The FCL vs LCL crossover sits at roughly 15 CBM in the 2026 rate environment. Below that, LCL with one or two consolidation partners; above that, FCL with optimized cargo mix.
The four cargo mix strategies above (cycling + camping, ski + hiking, hydration + apparel, bottles + accessories) cover roughly 80% of mixed-SKU consolidation scenarios in outdoor gear. Each pairs a dense SKU with a less-dense SKU to balance the container’s weight and volume limits in a single shipment.
Container utilization rate is the metric to track across every shipment. Aim for 80%+ on FCL loads. Below 70%, the wasted space is hiding a per-unit cost penalty that erases any FOB savings.
The September 2026 freight rates ($6,726-$8,221 per 20GP, $6,770-$8,275 per 40HQ) are volatile; expect a 2-3 week quote validity and re-quote before every booking. The negotiable components of the landed cost stack total roughly $9,000-$13,000 per 40HQ; a 10-15% reduction through competitive quoting is achievable and worth pursuing every quarter.
Customs pre-checks (ISF + FDA PN for US; CE + REACH + EORI for EU) are non-optional and cannot be backdated. Get them on file before the first booking.
About the Author
The AnttifySport Sourcing Team supports wholesale buyers, importers, and brand owners sourcing hiking, camping, cycling, and skiing gear from qualified Asian factories. We’ve worked with over 200 B2B clients across North America, Europe, and Australia since 2018, with a focus on low-MOQ custom orders and OEM/ODM partnerships for emerging outdoor brands.
Have a sourcing question or want to discuss your next product line? Reach out at https://www.anttifysport.com/contact/.
Further reading & sources
- Sino-Shipping, China-to-USA Freight Rate Update, September 2026 — used for current FCL, LCL, air, and express rate figures
- ExFreight, Ocean Freight Rates 2026: Prices, Surcharges & Savings — used for rate structure and surcharge reference
- U.S. Customs and Border Protection (CBP), Importer Security Filing (10+2) Requirements — referenced for ISF rules and penalties
- U.S. Food and Drug Administration, Prior Notice for Imported Food — Guidance for Industry — referenced for FDA PN rules on food-contact products
- U.S. Consumer Product Safety Commission (CPSC), Certificate of Conformity Requirements under CPSIA — referenced for children’s product certification
- European Chemicals Agency (ECHA), REACH Regulation — Substances of Very High Concern — referenced for EU chemicals compliance
- European Commission, CE Marking and Authorized Representative Requirements — referenced for EU product compliance
- European Commission, EORI Number Allocations and VAT Import Procedures — referenced for EU importer registration
Public data sources cited; freight rates are indicative and change weekly. Verify specific rate quotes and customs requirements against your forwarder’s current rate sheet and the destination country’s customs authority before finalizing logistics decisions. HTS classifications vary by product category; consult a customs broker for binding rulings.
This article is for informational purposes only and does not constitute legal, financial, customs, or professional logistics advice. Container freight rates, customs documentation requirements, and duty rates referenced here reflect publicly available industry data as of September 2026; specific logistics decisions should be validated against current freight forwarder quotes, binding customs rulings, and the latest guidance from licensed customs brokers in the destination country. The author and AnttifySport make no representations or warranties regarding the accuracy of freight rates or customs procedures for any specific shipment. Container utilization calculations and cargo-mix recommendations are general frameworks; specific outcomes depend on packaging dimensions, freight class, and individual carrier practices that vary by route and season.
Related Products from AnttifySport
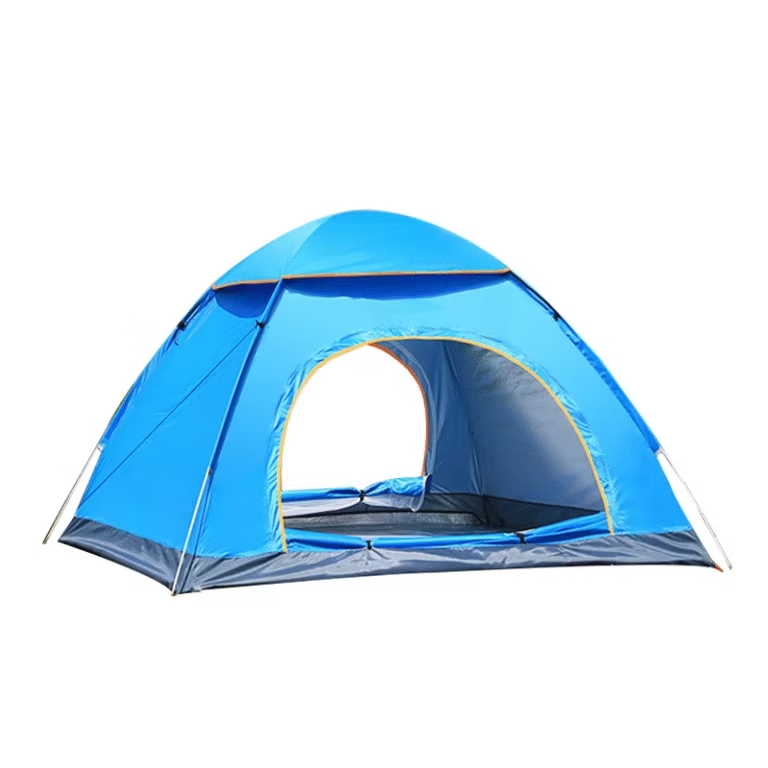
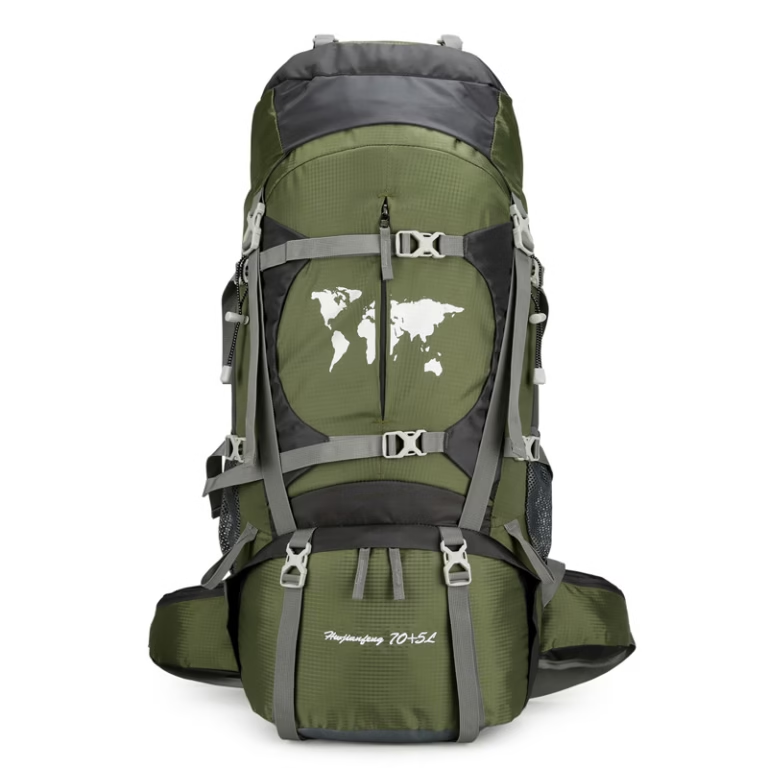
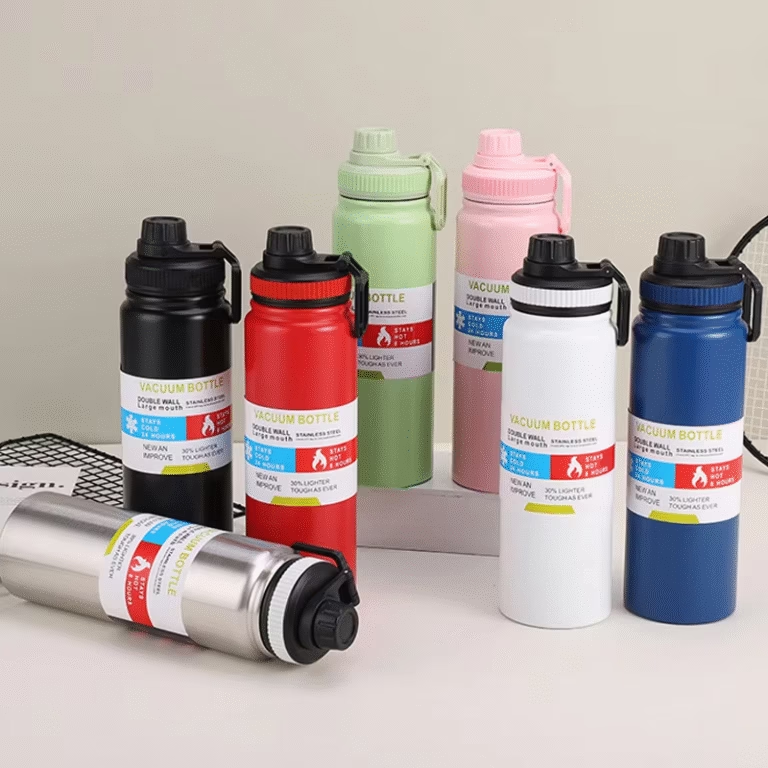
Browse the AnttifySport catalog for outdoor gear covered in this article. All products shown here are part of our wholesale lineup — wholesale pricing, low MOQ, and OEM/ODM support available. Contact our team for quotes.